Since COVID-19 emerged in early 2020, the virus has had a huge impact on the NHS and the country more widely. This blog compares the COVID-19 pressures trusts in England have faced during the first wave in March to May 2020, with the situation in the current wave starting in late 2020 - which for the purposes of this blog will be described as the second wave.
The data
The availability of robust, accurate and timely data is essential for our understanding of the pandemic. Like many things, COVID-19 data collection and reporting began from a standing start in early 2020, and over time we have seen the range and depth of published data expand. There are now real-time official figures published across a range of indicators that we can use for analysis and comparison, including:
- Daily cases – data from the government on the number of positive COVID-19 cases reported
- Hospital admissions – daily NHS England and NHS Improvement (NHSE/I) count of new COVID-19 admissions to hospital
- Patients in hospital – daily NHSE/I count of the total number of COVID-19 patients in hospital
- Patients in mechanical ventilation beds – daily NHSE/I count of those with the most severe COVID-19 illness requiring ventilation
- Deaths – daily data from the government on the number of people who have died within 28 days following a positive test (data is also available from the Office for National Statistics looking at death certificates that mention COVID-19 as one of the causes, but this is published with a significant lag)
Looking specifically at these five key measures in England, it is clear the second wave has surpassed the levels reached during the first wave. The following table highlights the difference between the maximum figure reached during the first and second waves.
Note: the first wave peak is the maximum daily figure for each of the above measures between 17 March 2020 and 31 May 2020, the second wave peak is the maximum daily figure between 1 December 2020 and 15 February 2021
Daily cases:
- Testing was significantly limited in the first wave, so it is difficult to directly compare the number of positive cases with those recorded in the current wave. However, for scale, there were approximately 2 million positive cases recorded in December 2020 and January 2021, including a daily high of 61,757 on 8 January. Across the previous ten months between the start of the pandemic up to 1 December there were 1.3 million cases recorded.
Hospital statistics:
- Between 1 December 2020 and 31 January 2021 there were almost 160,000 COVID-19 admissions to hospital. This is an average of more than 2,500 admissions per day, and on 12 January there were a record 4,134 admissions. Over a comparable 62-day period during the first wave (20 March to 20 May 2020), there were 93,000 admissions, which equates to 1,500 per day.
- The total number of COVID-19 patients in hospital during the second wave reached unprecedented levels. Across the whole of January 2021, there were an average of 30,500 COVID-19 patients in hospital every day. While the pressure on hospitals in the early stages of the pandemic was undoubtedly intense as many new challenges were tackled for the first time, the pressure on the NHS during the second wave has far exceeded this. In total, between 1 December 2020 and 31 January 2021, COVID-19 patients accounted for 1,450,000 NHS bed days[1], which is almost double the amount during the first wave (92% higher than the 752,000 recorded between 20 March and 20 May 2020).
- Many of the sickest patients require mechanical ventilation, and we have seen a similar sharp rise here during the second wave. Trusts have opened large numbers of critical care beds to accommodate the growing number of these patients. By the end of January 2021 there were 68% more of these beds open across the country than the same time a year ago, and almost nine in ten of these beds were occupied. At the peak of the first wave, considerable surge capacity had also been deployed, but this only rose to 41% more beds open than the previous year's level, and occupancy was a slightly more manageable 80%.
Deaths:
- On 26 January 2021, the UK passed the tragic milestone of 100,000 deaths from the virus when looking at the government daily deaths data. In January 2021 alone, England recorded almost 30,000 COVID-19 deaths, approximately one-third of the country's total to date.
- Since the early days of the first wave there has been debate around the definition of a 'COVID-19 death'. Data from the Office for National Statistics helps to explain some of the details, and it is clear both waves have had a terrible toll. On the basic measures of those who died within 28 days of a positive COVID-19 test, as well as those who had COVID-19 recorded on their death certificate, the total in the second wave is higher than the first. However, during the first wave, there have been a greater total number of deaths to date above the historical average across this period.
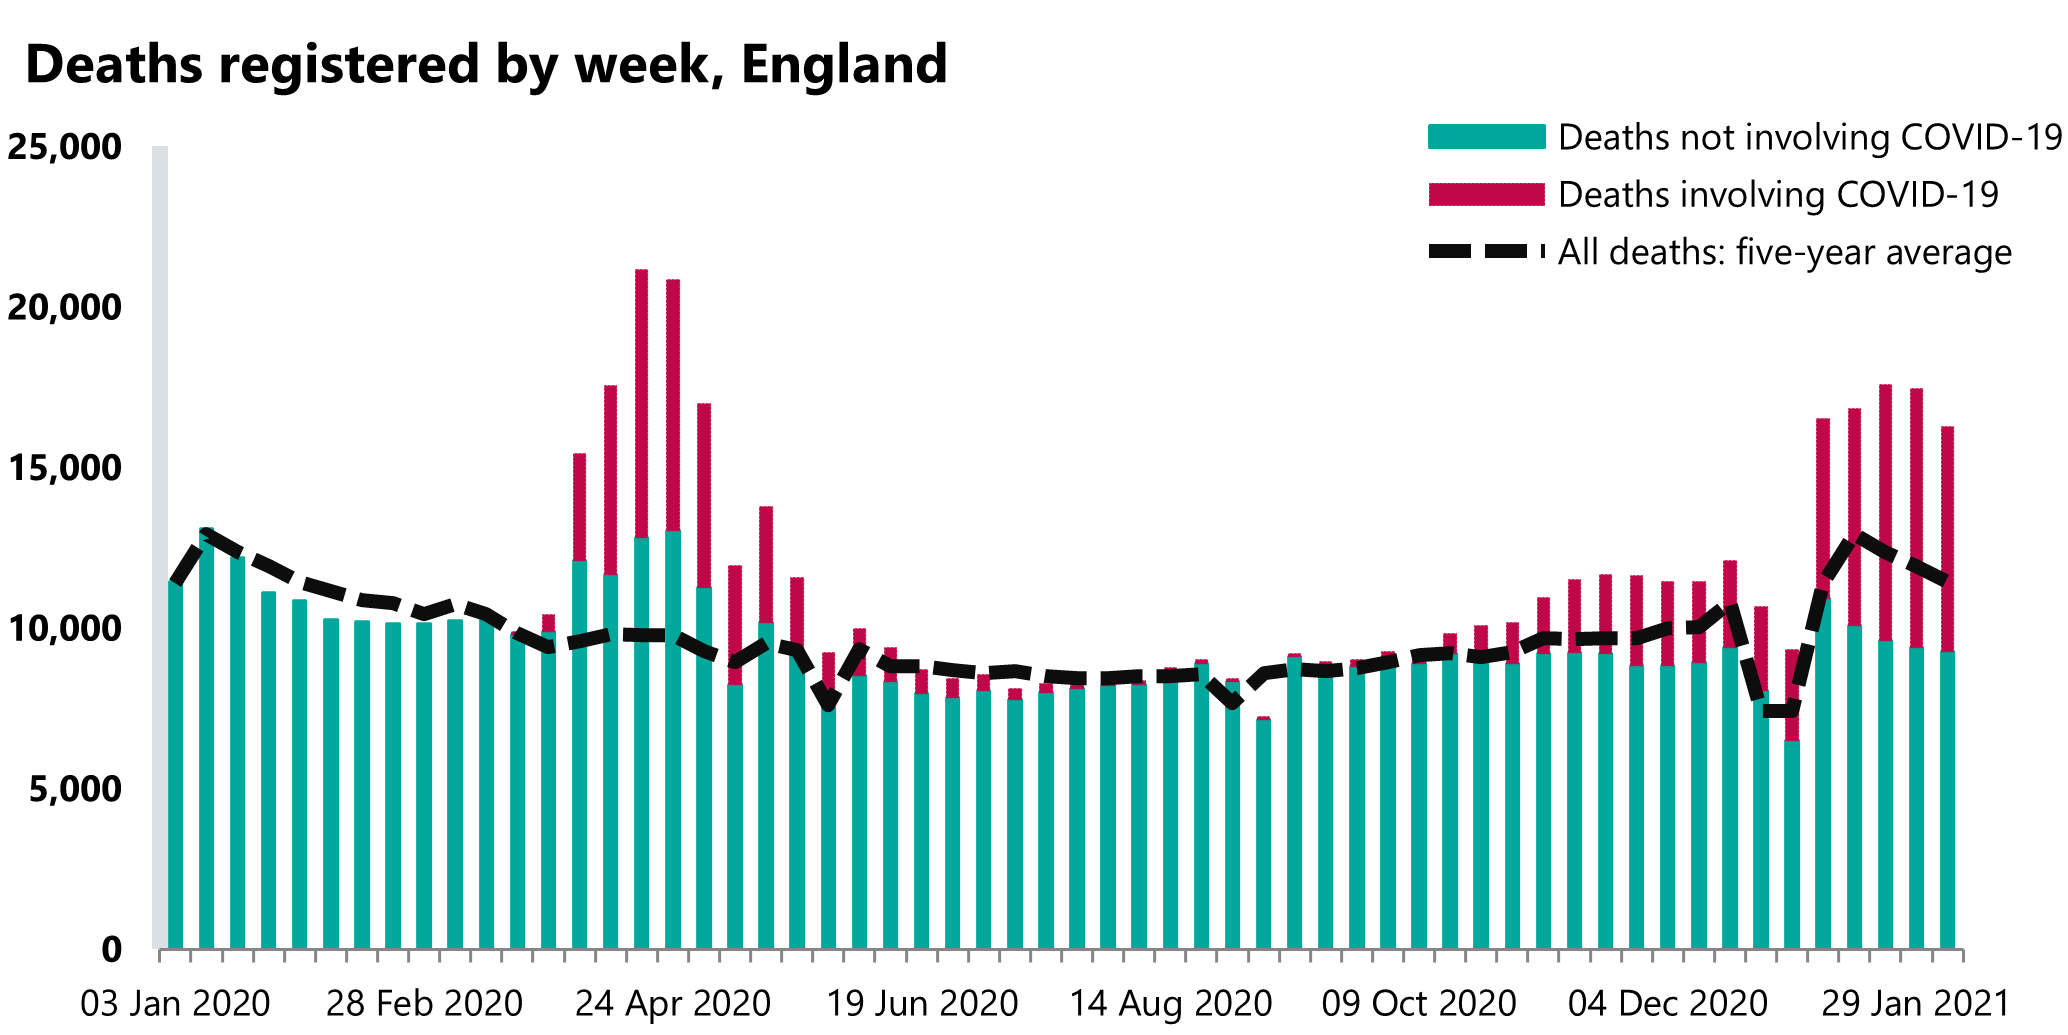
Source: Office for National Statistics, deaths registered weekly in England and Wales, provisional statistical bulletins.
Regional perspective
These headlines go some way to explain the national picture, but it is also important to track the virus on a regional basis. Through the tier system and regional lockdowns, efforts have been made to balance public health measures and the capacity of local health systems with wider economic and social outcomes.
In the first wave, London was the centre of the early outbreak, but this quickly spread to other parts of the country. Gradual recovery led to an encouraging few months in the summer where the number of cases in every region was far below the level seen during the first wave, even as access to testing was greatly expanded. Autumn saw several new outbreaks gathering speed, particularly in the North West and North East and Yorkshire. The introduction of regional restrictions (and the subsequent national lockdown) did then begin to have an effect, as numbers started to fall in these areas in November.
However, as warned by many, winter posed a new threat as a combination of factors made conditions more conducive to the transmission of the virus. The emergence of a highly contagious new variant in Kent fuelled a rapid expansion of cases, with London, the South East and the East of England rising fastest.
The number of patients in hospital in each region per 100,000 residents gives a clear view of the pressure trusts have been under.
From these population adjusted figures we can see London has suffered greatly in both waves, and all regions have seen much greater demand for hospital services in the second wave compared to the first. While other factors including hospital capacity, demographics and workforce all play a big part in a region's ability to provide care, the sheer scale of the COVID-19 demand has caused huge disruption in every region. To put this into perspective, COVID-19 patients made up 43% of all hospital patients in England at the peak of the second wave, and as many as 52% in London.
Conclusion
From the above, we can draw robust conclusions that the burden on the NHS in the second wave has surpassed the first wave. The new variant has clearly played a part, with early estimates suggesting it could be as much as 50% more infectious, and the risk of death 30% higher once infected. Some commentators have noted other instances of the second wave of a pandemic having a greater impact than the first. Notably, there were far more deaths during the second wave of the Spanish flu pandemic than the first. As was the case a century ago, a wide range of factors are likely to be driving the scale of the second wave of COVID-19.
Over the past year, there has been genuine progress in many aspects of our response to the virus. Testing capacity has been hugely expanded and the contact tracing system is becoming more effective. We have far greater knowledge of the disease and how to treat the sickest patients, which has meant there are much better outcomes for many of those testing positive now. Additionally, we have been better placed to respond over winter than at the beginning of the pandemic through a range of operational improvements including:
- enhanced NHS escalation plans
- established collaborative relationships and mutual aid within local systems
- improved distribution and supply of personal protective equipment
- more effective management of risk in care homes
Alongside this, the rapid progress of the vaccination programme is quickly moving us towards a position where a very large proportion of those most at risk of serious illness are protected. There is great hope that as the extreme pressures of the second wave gradually recede, the NHS will be able to take stock and recover in the coming months.
Several key challenges still present significant hurdles. Balancing staff wellbeing with the implementation of recovery trajectories to make headway on the large backlogs of non-COVID care is essential. In addition, the ongoing efforts to control the spread of the virus are as important as ever, particularly as new variants emerge, and the impressive roll-out of a sustainable vaccination programme must be maintained.
[1] The total number of bed days are calculated by adding the daily totals of beds occupied by COVID-19 patients across each of these periods