

Introduction
Today NHS England published the winter situation reports, which provide a snapshot of activity across emergency care and hospitals from 12-18 December. The weather last week was particularly cold across England with sub-zero temperatures and snow in some places.
The 'twindemic' is being felt across NHS services. COVID-19 hospital activity continues to increase. As of 14 December, there were 6,720 patients in hospital, a fifth more than in the previous week and 4% more patients than the same day last year.
Today's flu report shows the influenza-like-illness (ILI) GP consultation rate increased from 15.5 per 100,000 registered population to 23.9 per 100,000 last week. The rate is also higher than the same week in 2019 where the rate was 16 per 100,000. This flu season is proving to be more severe than during the pandemic, when there were low flu rates, and the years leading up to the pandemic. Today's data shows the extent to which flu is putting additional pressure on already overstretched services.
COVID-19 hospital activity and flu indicators are key metrics that sit alongside the winter situation reports and help give us additional context to external factors placing additional stress on the NHS.
The data covering last week shows a continuation of trends observed last week, with trusts across England under immense pressure.
Winter situation report (12–18 December)
A&E closures & diverts: There were no A&E closures again this week. There were 12 total A&E diverts this week, three fewer than the week prior.
Ambulance arrivals: A total of 69,350 patients arrived by ambulance. This is a decrease of about 7% since last week and down by about 17% compared to the same week last year.
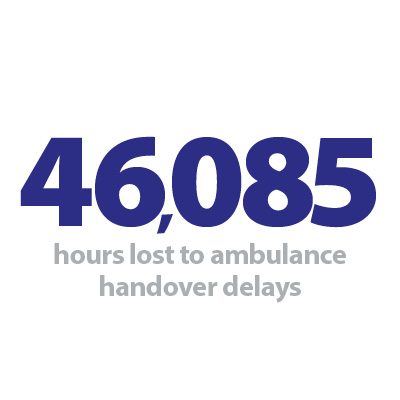
Ambulance handovers: About 41% of ambulance handovers were delayed by 30 minutes or more, up from 34% last week and an increase of a fifth compared to last year. A total of 46,085 hours were lost to ambulance handover delays.
General and acute (G&A) beds: There were an average of 100,101 G&A beds open each day – 3,552 more than the same time last year, an increase of about 4%. On average each day 256 beds were unavailable and void due to non-COVID infections. Average bed occupancy remains high at 94.4%. This is an increase of 2.3 percentage points compared to the same week last year.
Critical care: Adult critical care bed occupancy increased this week to 81.6%, up from 80.1%. This is slightly higher than levels seen in the same week last year (79.8%).
Diarrhoea and vomiting (D&V): The number of beds closed due to D&V and norovirus has decreased this week, with an average of 432 beds closed per day. This is down from 461 last week but above levels seen this time last year (318).
Discharges: There were an average of 22,771 patients each day who no longer met the criteria to reside, an increase of about 2% on the previous week. Of these, 60% (or 13,697) stayed in hospital this week, a slightly higher proportion to last week.
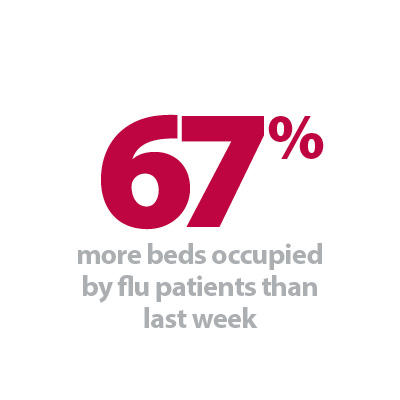
Flu: This week the average number of G&A beds occupied by flu patients each day increased by 67% to 1,939. An average of 149 critical care beds were occupied by flu patients each day this week (72% more than the week before). Compared to the same week last year, the average number of G&A beds occupied by flu patients each day has increased to 1,909 beds. The average number of critical care beds occupied by flu patients has increased from the same time last year (146 more). These considerable increases are because last year flu was not prevalent due to COVID-19 restrictions and social distancing.
Long stay: The number of patients staying in hospital longer than seven, 14 and 21 days has increased since last week (up by 0.6%, 0.5% and 0.9% respectively). Compared to the same time last year, the number of patients staying in hospital for longer than seven, 14 and 21 days have all increased (up by 12.4%, 18.7%, and 24.8% respectively).
Neonatal intensive care beds: Occupancy has increased from last week and is at 70.6%, up from 69.3% last week but down from 72.3% the same week a year before. The average number of care beds open is at 1,707, a similar level to the week before and 1% higher than the same week last year.
Paediatric intensive care beds: Occupancy has decreased this week to 87.9%, down from 89.4% last week. This is higher than the same week last year (81.1%). The average number of care beds open has risen to 372, up by 2% on last week and up by 2.5% compared to the same week last year.
Staff absences: There was an average of 60,583 total absences each day this week, of which 12% were COVID-19 related (7,218). The total number of staff absences has once again increased from the week before, and the proportion of COVID-19 related absences has increased slightly (up from 11%).
Our view
The data this week shows a continuation of sustained pressure across NHS services. Hospital capacity remains under pressure due to a range of factors.
The number of flu patients in hospital has jumped up by two-thirds in the last week, confirming that the community prevalence of flu, alongside COVID-19 patients, is having a knock-on impact on hospital capacity.
Patients are also staying in hospital longer. This is due to increases in acuity of patients, as well as a significant increase in the number of medically fit patients residing in hospital due to delayed discharge. The number of delayed discharges increased again this week, signalling a continuation of the system wide pressures trust leaders are so worried about, particularly a lack of provision for at home care or across care home.
A small number of beds also remain closed due to D&V and norovirus. However, more positively, hospital capacity has grown to over 100,000 beds, an increase on the same time last year.
Pressures across urgent and emergency care remain high. Despite a small decline in ambulance arrivals this week, handover delays have increased, with more than 40% of all handovers to hospital taking 30 minutes or more. This metric, alongside delayed discharges, show system-wide issues with patient flow. The number of hours lost to handover delays increased by 58%, reaching over 46,000 hours in one week.
Workforce gaps remain a daily challenge. Record vacancies, high rates of staff sickness and industrial action are compounding these seasonal operational pressures. The NHS urgently needs a fully costed and funded long term workforce plan.
Tackling the elective backlog: One of the NHS priorities this winter
Shilpa Ross, policy fellow, and Nicola Blythe, researcher at The King's Fund discuss their research into how to reduce the elective care backlog.
The health and care system has entered winter under enormous pressure, with performance figures consistently showing the NHS bursting at the seams as it attempts to meet sharply rising demand while keeping patients safe. There are pressures on multiple fronts – workforce, finances and on the A&E pathway – and the elective waiting list has reached an unprecedented 7.2 million people. The figures show that while the number of people waiting more than two years for routine procedures has decreased to 1,900, one-year waits are still increasing, currently at 411,000 people.
At The King's Fund, we carried out major research to understand the elective waiting list better, and the approaches that have been used in England and elsewhere to reduce waits in the past 20 years, the impact of these approaches and what lessons can be learned, particularly from the early 2000s when waiting times were reduced.
Performance management also played a role in reducing waiting times and included both challenging and supporting local NHS organisations to improve their performance.
Experts from the early 2000s told us that the achievement of reducing the 18-week target was made possible due to more than just pouring resources into the system. They told us it was possible via a combination of valuing and investing in people working in the NHS; having a clear, central vision that those working within healthcare felt equipped to take on; cultivating relationships and leadership at all levels within the system; aligning accountability, incentives and targeted support to encourage performance against targets; and seizing the momentum of wider NHS reform.
Performance management also played a role in reducing waiting times and included both challenging and supporting local NHS organisations to improve their performance. But our research showed that care must be taken to avoid unintended consequences of performance management regimes, which could include 'gaming' of targets, a culture of fear and low staff morale, and distorting priorities so that only what gets measured matters.
Ultimately, and very simply put, the pressure the system is under is a result of the mismatch between demand for, and available supply of, healthcare. Understanding the root cause of these disparities and optimising conditions within the health service itself is the key to any strategy to reduce waiting times. To increase supply, factors that must be looked at include levels of funding, investment in our workforce, the number of beds, equipment, facilities and technology to deliver care.
To manage demand, there must be a concerted effort to maximise the opportunities afforded by integrated care systems to address the health needs of the population in the spirit of prevention and community-based care. Alongside addressing this mismatch of supply and demand, there is also a need to create the optimum conditions for the healthcare system to thrive, both culturally and operationally. This means aligning a vision with a plan that brings staff, patients and the public along on the journey to get there.
Even in the depths of winter, there is some hope that can be taken from the fact that extremely long elective waits have been brought under control before.
By not plugging this disparity in the period since 2009, waiting times for elective care have increased and the COVID-19 pandemic has only added to the scale of this challenge. As the system navigates this winter, reducing the waiting list will also be impacted by staff strikes over pay and conditions, with figures showing that 2,452 elective inpatient operations were cancelled by the first strikes by nurses. The health and care system is also simultaneously contending with a £10bn maintenance backlog, unsustainable pressures on social care, and 130,000 NHS staff shortages.
We are now in a very different political and economic context as we enter this winter compared with the early 2000s. It is unlikely that applying individual policy initiatives from the past would be effective today unless shortages of healthcare staff and physical resources are urgently addressed. But, even in the depths of winter, there is some hope that can be taken from the fact that extremely long elective waits have been brought under control before.