This section looks at each key element of what NHS trusts need to deliver in 2017/18 and assesses what it would to take to achieve this. These elements are:
- absorbing 2017/18 NHS cost and demand increases
- delivering the 95% 4-hour A&E and 92% 18-week referral to treatment time elective surgery standards
- delivering new commitments from cancer and mental health taskforce recommendations
- eliminating the provider sector deficit.
We also consider the impact of the recent Budget announcements and triangulate the conclusions against NHS trust performance in 2016/17.
NHS 2017/18 cost and demand increase
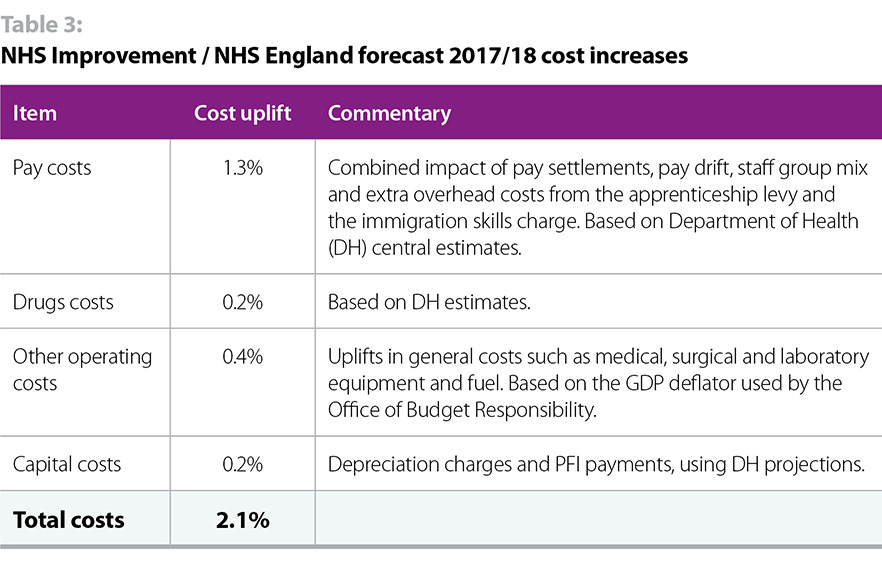
The 2017/19 NHS tariff sets out a forecast of how NHS costs will rise by 2.1% in 2017/18. Table 3 below sets out the relevant items, with a short commentary.
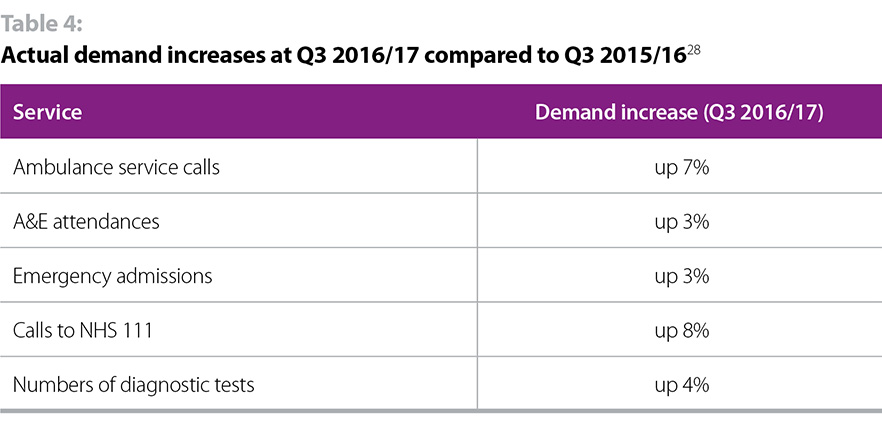
NHS demand in 2017/18 is scheduled to rise by 3.1% according to the Nuffield Trust’s analysis of NHS England’s assumptions to 2020. Demand increases in Q3 2016/17 compared to Q3 2015/16, are in line with the 3.1% assumption, as set out in table 4 below.
In summary, NHS cost and demand is forecast to rise by 5.2% in 2017/18. CCG and specialist commissioning funding allocations are due to rise by 2.6%. This leaves a 2.6% gap.
Over the last few years, the NHS has planned on the basis that the gap between cost / demand increases and NHS funding increases would be filled by provider efficiency and productivity savings and gains. Between 2011/12 and 2015/16 providers were therefore set an efficiency target of 4%. In the view of the National Audit Office, the public accounts committee, the chief executive of NHS Improvement (public accounts committee, 18 January 2016) and the Nuffield Trust, this has placed an undeliverable expectation on NHS trusts and has directly led to record provider deficits.
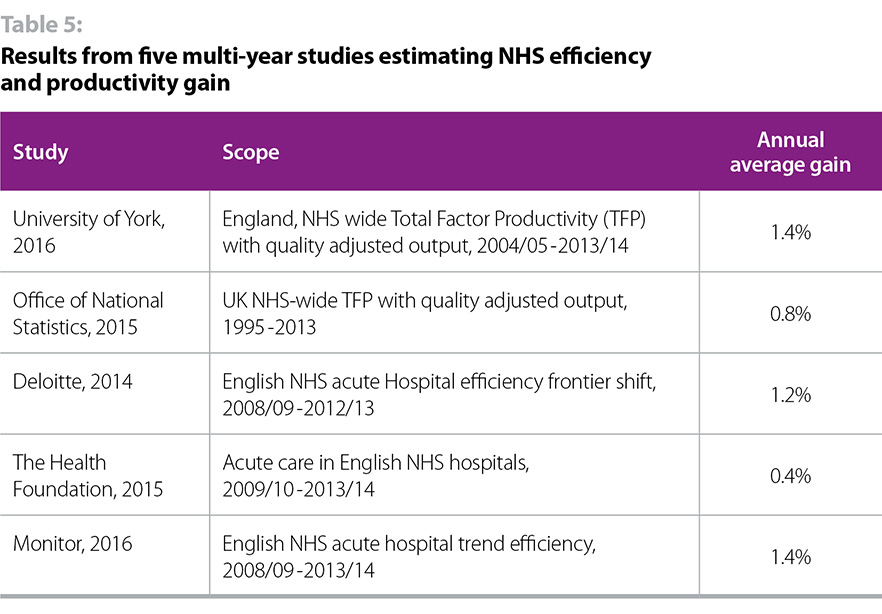
In the 2016/17 tariff providers were set a 2% efficiency target. This is regarded as the most stretching reasonable target to set, particularly when considering the improvements that have been delivered in practice. Although these are difficult to calculate, table 5 below sets out the results of five multi-year studies measuring NHS efficiency and productivity improvements across several years. It is striking that the highest (and mode) result is 1.4%, some way below the 2% target.
So, even on the best case scenario of hitting the required 2% efficiency target (an ambitious assessment as set out in table 5), NHS providers face a significant gap arising from the difference between 2017/18 cost / demand increases and funding / efficiency increases. This is set out in table 6.
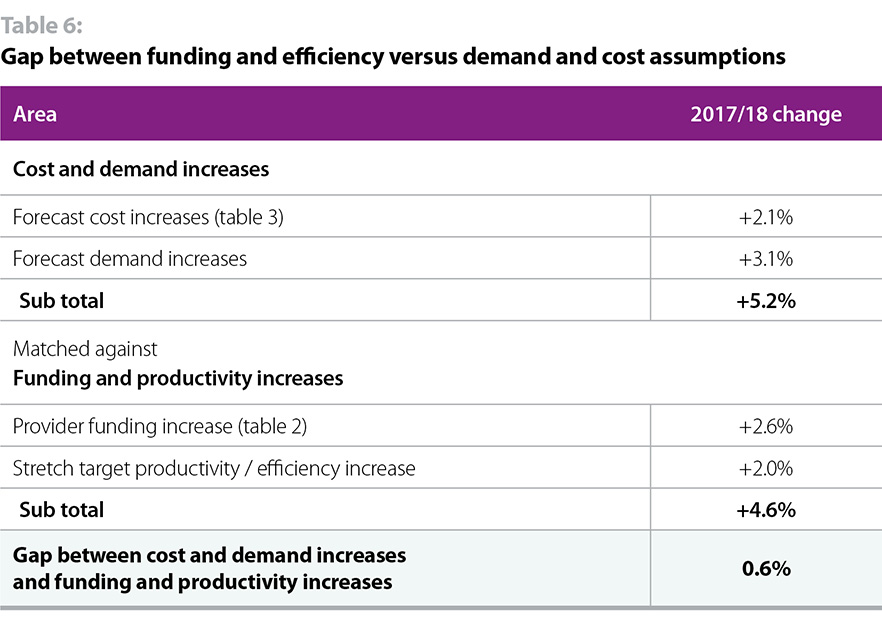
There is a gap of 0.6% for providers to close in 2017/18 just to maintain the existing levels of performance, without taking account of the need to:
- improve performance to regain required performance against targets (see section on target and performance delivery)
- deliver extra mental health and cancer commitments (see section on new commitments)
- improve financial performance to eliminate the provider deficit (see section on achieving financial balance)
Target/performance standard delivery
The 2017/19 planning guidance requires providers to meet a range of performance standards covering A&E, elective surgery, diagnostic waits, cancer care, ambulance response times, infection control and mental health standards. To illustrate the financial challenge associated with meeting this task our analysis focuses on two key hospital performance standards on A&E and elective surgery. These are the most well-known and most scrutinised targets, and they have the best quality data. However the scale of the performance challenge across all sectors – mental health, community and ambulance – is just as great.
Current performance
The NHS mandate requires NHS trusts to treat, admit or discharge 95% of accident and emergency patients within 4 hours. As we set out in our November 2016 The state of the NHS provider sector report, performance against the four-hour A&E standard has declined significantly over the last few years. As figures 1 and 2 below show, the last time the standard was consistently met for all types of A&E was in 2013/14, and for type 1 (major A&E departments) the standard has not been consistently met for over 5 years. Performance in January 2017 was the worst on record, at 85.1% for all types and 77.6% for type 1.
Figure 1
Figure 2
Delivering the 95% standard in 2017/18
Performance against this standard is determined by demand and capacity levels and whether improvement activity is enabling providers to perform better. There is no evidence to suggest that any of these factors will change sufficiently to enable the 95% performance standard to be regained. On current trajectory, we believe performance is more likely to deteriorate than improve.
Demand for A&E services has risen continuously over the last five years, as measured by both A&E attendances and admissions, with strong evidence that growth in demand is speeding up. The NHS is treating more patients than ever before and performance remains high by international standards. However historical performance shows that the number of patients seen within four hours remains relatively stable. This means an increasing performance gap against the 95% 4-hour standard as demand grows. This is illustrated in figure 3 below.
Figure 3
Demographic and disease burden pressures – particularly the growth in the number of frail elderly with multiple long term conditions – will increase demand in 2017/18 (the Office for National Statistics predicts an 89.3% rise in the number of people aged 75% and over between 2014 and 2039, a 100% in those aged 85 and over, and 600% rise in the number of centenarians.) The emerging evidence from the new care models programme suggests that it may be possible to reduce A&E demand over the longer term by integrating care more effectively, increasing out of hospital capacity and improving primary care. However there is no evidence to suggest that these will be delivered at sufficient scale and pace to significantly reduce demand in 2017/18. It is likely that demand for A&E services will, at best, remain at the current rate of growth and, at worst, increase.
There are no current plans to significantly increase A&E capacity on a system-wide basis (much needed though this is) and, on current plans, no extra money available to fund such a capacity increase.
There are a number of different A&E performance improvement initiatives under way, however given expected continuing demand increases, we do not believe they will deliver sufficient performance improvement to hit the 95% A&E standard. In reaching this judgement, we are drawing on the experience of 2016/17 when trusts were given strong financial incentives to hit the 95% standard, supported by a range of performance improvement initiatives, but performance still declined as demand climbed. Our analysis of the impact of the 2017 Budget is contained in the section on achieving financial balance below.
Without substantial extra investment, our judgement is that it is impossible for the sector to achieve the 95% A&E standard in 2017/18.
What would it take to meet the 95% standard?
It is impossible to model exactly how much extra resource would be required to consistently deliver the 95% standard across the whole of 2017/18. However, looking at the forecast cost of providing A&E services in 2017/18, and modelled A&E income for 2017/18 we can estimate that A&E services will be underfunded by around £400-600 million. In reality, of course, even if this funding were available, the NHS would have to create the extra capacity – doctors, nurses and mental health, acute or community beds or visits – to provide the extra treatment required. Given workforce shortages, it is difficult to see where the extra staff would come from and extra beds take time to create. Using current demand trajectories, we have estimated the extra number of patients that would need to be seen to meet the 4-hour standard as around 1.8 million.
92% referral to treatment time elective surgery standard
Current performance
The NHS Mandate requires NHS trusts to treat 92% of non-emergency patients within 18 weeks. Performance against this standard has declined significantly over the last 22 months. As figure 4 below shows, the last time the standard was met was in February 2016; in January 2017 performance against the standard was 89.9%. Waiting times topped 20 weeks in December 2016, the worst performance since March 2011, before the target was even introduced.
Figure 4
Delivering the 92% referral to treatment time standard in 2017/18
Performance against this standard is also determined by demand and capacity levels and whether improvement activity is enabling providers to perform better. Again, there is no evidence to suggest that any of these factors will translate into sufficient performance improvement in 2017/18 to regain the 92% performance standard. On current trajectory, we believe performance is more likely to deteriorate than improve.
Demand for elective surgery has risen continuously over the last five years, as shown in figure 5 below.
Figure 5
Again we know that demographic pressures will increase demand in 2017/18. There are no current plans to significantly increase elective surgery capacity on a system-wide basis and, on current plans, no extra money available to fund such a capacity increase. Compared to A&E there are fewer performance improvement initiatives under way and there is no evidence that they will be able to deliver significant, system-level, performance improvements in 2017/18.
On that basis, without substantial extra investment, our judgement is that it is impossible for the sector to achieve the 92% RTT standard in 2017/18. This is confirmed by Rob Findlay, an industry analyst specialising in RTT waiting times, who said in December 2016: “Every trust in England has agreed a trajectory to recover and sustain ’18 weeks’, but things are clearly heading in the wrong direction. Unless something big happens, and the NHS starts keeping up with demand again, I cannot see the 18-week target ever being achieved again.”
What would it take to meet the 92% standard?
It is impossible to model exactly how much extra resource would be required to deliver the 92% standard in 2017/18. However, methodologies to calculate this figure involve estimating the cost of eliminating the backlog as well as the extra level of activity required to keep up with increasing demand. NHS Providers estimates that the range of extra cost to regain and consistently meet the 92% 18-week standard across all of 2017/18 would be between £2-2.5bn (NHS Providers figures based on NHS Improvement estimates). We recognise that this range can only be indicative. Capacity and workforce constraints would apply in terms of delivering the standard across the whole of 2017/18.
4.3 New cancer and mental health taskforce commitments
The Independent Cancer Taskforce published its results in July 2015 which was followed by the publication of NHS England’s detailed delivery plan. These add a new set of extra requirements on trusts, in addition to what was delivered in 2016/17. These requirements include significant improvements to one-year survival rates, as well as giving patients definitive cancer diagnosis, or the all clear, within 28 days of being referred by a GP. The extra cost of this 2017/18 cancer taskforce related activity is estimated as £90-120 million constituting a further financial pressure for trusts that was not present in 2016/17 (NHS Providers estimate based on NHS England cancer taskforce implementation strategy).
NHS England published the results of its mental health taskforce in February 2016 which was followed by the publication of a detailed delivery plan. These add a set of extra requirements on trusts including increasing the number of people with a severe mental illness receiving a full annual physical healthcheck, increasing the number of people access psychological therapies and increasing the number of hospitals with an all-age mental health liaison service achieving the Core 24 service standard. The extra cost of this 2017/18 mental health taskforce related activity is estimated as £60-80 million (NHS Providers estimate based on the Five year forward view mental health implementation plan), constituting a further financial pressure for trusts that was not present in 2016/17.
Eliminating the provider financial deficit and achieving financial balance in 2017/18
The final key requirement for trusts in 2017/18 is to achieve financial balance by eliminating the provider deficit which, in Q4 2015/16, stood at £2.45 billion.
The NHS provider sector delivery task increases when the sector ends a year in deficit. Trusts then have to improve their financial performance by a similar amount to end the following financial year in financial balance.
The original 2016/17 NHS England provider sector financial target was -£250m partly because this was regarded as the “worst” 16/17 financial performance commensurate with hitting financial balance in 2017/18. NHS Improvement then set the target at -£580m. The latest official data at quarter 3 shows the sector headed for a -£873m deficit in 2016/17. We have estimated the end year provider sector as being between -£800m and £900m. This means that NHS trusts will have to improve their financial position by at least that amount to achieve financial balance next year.
NHS trusts are relying on significant levels of one-off, non-recurrent, savings to deliver their year end targets
Our recent survey of trust finance directors shows that the picture is, in reality, worse than this as trusts are relying on significant levels of one-off, non-recurrent items, balance sheet adjustments and capital to revenue transfers to deliver their year end targets. Of trusts responding, 66% report they are either very or fairly reliant on these elements to meet their 2016/17 financial control totals. NHS Providers estimates that they constitute up to £1 billion of one-off gains for the sector as a whole. Trusts consistently tell us that they do not believe they will be able to realise similar levels of non-recurrent gains next year. However, following the conservative approach, we use the £800-900 million figure in the rest of our analysis.
The scale of pressure on provider sector finances in 2017/18 is revealed by the following new data from our recent finance directors’ survey which shows:
- 30% of trusts have not yet signed up to a 2017/18 control total
- trusts who have not signed up to a control total would have had an undeliverable median efficiency requirement of 6.4% which explains why those trusts have been unwilling to sign up to a control total for 2017/18
- of those who have signed up to a 2017/18 control total no trusts are very confident and less than one in five (19%) are fairly confident of hitting their control total.
In summary the scale of the 2017/18 provider delivery challenge is significantly increased by the fact that providers are likely to start the year with a minimum financial pressure of £800-900 million.
Budget 2017
The 2017 budget announcements of £2 billion for extra social care, £100 million capital for extra GP front door triage in A&E departments and £325 million capital for the most advanced sustainability and transformation (STP) footprints were welcome. However they are unlikely to make a significant difference to this underlying position. The impact of extra social care support on NHS performance in 2017/18 is uncertain given that there are no “must benefit the NHS conditions” attached to the new funding. £425 million of extra capital is marginal in the context of an estimated £2.4 billion a year required for STPs and a forecast maintenance backlog of £5.8 billion.
Triangulation of 2016/17 and 2017/18 information
One way of triangulating the size of the delivery task in 2017/18 is to make an explicit comparison with 2016/17, the current financial year.
This year, despite best efforts and a 4% NHS provider funding increase (see table 2), the NHS provider sector will:
- record a likely official £800-900m deficit
- significantly miss the 95% A&E standard with year to January 2017 average monthly performance at 83.3% for type 1 A&E departments and 88.9% for all types
- significantly miss the 92% RTT 18 weeks standard with performance currently at 89.9%.
In 2017/18, the NHS provider sector is being asked to:
- eliminate the official £800-900m deficit
- substantially improve performance to hit the 95% A&E standard at an extra cost that we estimate to be in the range of £400-600 million
- substantially improve performance to hit the 92% RTT 18 weeks standard at an extra cost that we estimate to be in the range of £2-2.5 billion
- deliver £150-200m of new commitments resulting from the cancer and mental health task forces
- absorb 5.2% demand and cost increases.
All on a 2.6% NHS provider funding increase which is smaller than the current financial year’s 4% increase. All the indications are that this is impossible.