The planning guidance for 2018/19 requires the NHS to achieve a financial breakeven position next year, including a pound for pound improvement in financial performance for the extra £650m added to the provider sustainability fund (PSF).
In this section, we look at what might happen to provider finances in 2018/19. We also look at how trusts are responding to their financial targets, known as control totals.
Context
The middle year of the spending review period – 2018/19 - set a very tough financial settlement for the NHS. Funding was expected to increase in real terms by only 0.5%, the lowest increase over the spending review period and well below the average increase of 3.7% per year since the creation of the NHS in 1948. Without extra funding the NHS would have faced a £4bn gap in its finances next year (Nuffield Trust, Health Foundation, King’s Fund, 2017).
In November 2017, the government announced an additional £1.6bn for 2018/19. This was welcome but fell well short of what the NHS needed to close the gap. This will increase the DHSC’s budget by 1.4% in real terms or, considered another way, by just 0.7% per head of the population (King’s Fund, 2017). This is below the 1.2% per person spending rise in 2017/18.
In the planning guidance, Refreshing NHS plans for 2018/19, the government topped up the £1.6bn with £540m from other DHSC funds. Increases were made to commissioner allocations, the provider sustainability and transformation fund (renamed as the provider sustainability fund) and a new commissioner sustainability fund (Figure 6). 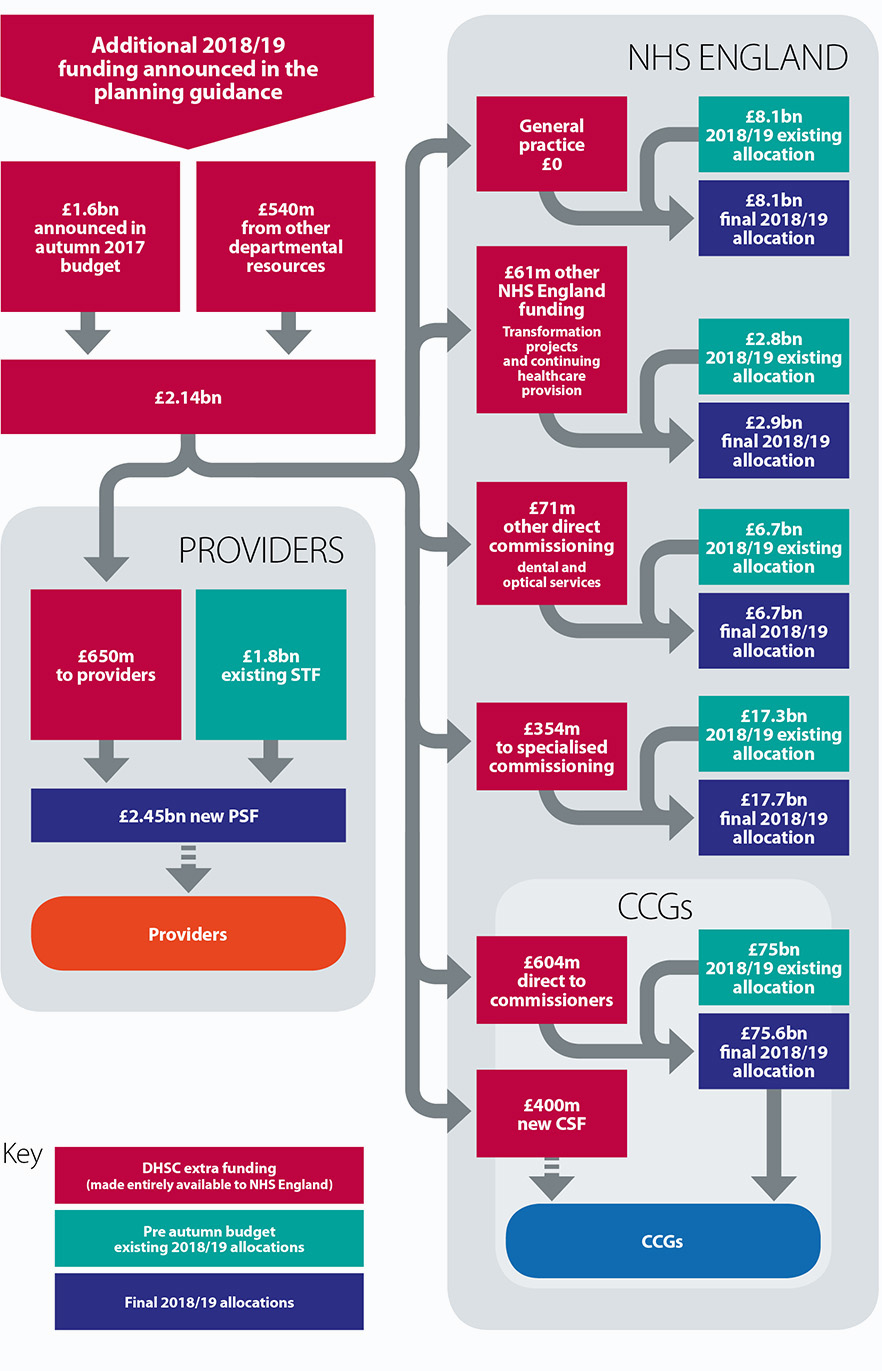
In exchange, the NHS trust sector was asked to deliver a break even position, something it has been unable to do since 2012/13. NHS trusts were also issued with a revised control total – a financial target determined by NHS Improvement that all trusts are required to achieve in order to unlock additional funding. These were adjusted as part of the planning guidance but crucially the efficiency expectations built in to these targets remained largely unchanged.
The prognosis for 2018/19
Even before 2018/19 has started, provider finances are on shaky ground. Progress in reducing the deficit has stalled this year as demand and cost pressures increased. To put it simply, the gap between the amount trusts are spending and the income/funding they receive has continued to grow. This makes next year’s finances even more challenging as we will be starting with a bigger hole in provider budgets, even with the additional funding announced in the budget.
By the end of December 2017, the sector was forecast to end the year £930m in deficit (up from £496m deficit plan at the start of the year). This looks set to worsen: of those trusts which were already behind their financial plan at quarter three, 60% told us that their financial position has deteriorated further, primarily as a result of the pressures the NHS has faced this winter. As NHS England’s chief executive Simon Stevens said, February was "the most pressured month ever for the NHS" (West, 2018).
There are more signs now that the NHS is being stretched beyond its limits than it was at this point last year. The sector started April 2017 with an underlying deficit of £3.7bn (Gainsbury, 2018), yet based on the current demand projections and cost pressures that is likely to increase further.
Achieving financial balance next year would require the vast majority of trusts to sign up to and then deliver their control totals, the financial target each trust is set by NHS Improvement and agreed, or not, by each trust board. However, when we surveyed trusts in February (just before draft financial plans were submitted) only slightly more than half of trusts (54%) indicated they would to sign up to their 2018/19 control total (Figure 7), and, of those, only just over a third (35%) were confident they could meet this (Figure 8).
Of those planning to reject their control total, the main reasons cited were that the targets were too ambitious given current financial position, and the quality of care could be compromised by unrealistic cost improvements. Another reason provided was that staff morale could be negatively affected by a culture of failure.
Figure 7
Figure 8
These concerns are explored in more detail below and can be seen as largely a symptom of a number of key risks in both income and costs for next year.
Table 3: Key cost and income risks in 2017/18
To achieve the position we need to deliver a CIP which is a 6.4% of turnover, for which we have not yet been able to identify any plans
The control total would require delivering the largest CIP we have ever made
Savings required
Delivering a breakeven position would require NHS trusts to achieve a level of savings not seen in recent years. The average cost improvement plan would need to be 5.7% of relevant turnover[1], which equates to savings in excess of £4bn next year. This is 20% more than the £3.3bn trusts are on track to deliver this year. For those trusts not planning to sign up to a control total, their average cost improvement plan increased to 8.2% (Figure 9).
Figure 9
[1] For the purposes of this analysis we have used relevant turnover rather than total turnover, which would also include pass through costs, research and development and other income. For the comparison to 2016/17, we have used 2016/17 turnover figures from NHS trust and foundation trust consolidated accounts.
The control totals for 2018/19 have not been modified for most trusts since they were originally set using 2015/16 performance, so it is perhaps unsurprising that many are reporting a higher savings requirement in 2018/19 given the deteriorating financial context most have faced this year.
The latest available figures show that the NHS is already delivering productivity gains of 1.8% (NHS Improvement, 2018), nine times that of the wider economy (Nuffield Trust, Health Foundation, King’s Fund, 2017). All the evidence says that the provider sector cannot deliver in excess of 2% efficiency a year (NHS Providers, 2017). The system has to be realistic about the level of savings it is possible to achieve.
Capital
Between 2014/15 and 2017/18, the DHSC switched £3.5bn from its capital budget to the revenue budget, to support day to day spending. The backlog maintenance bill for NHS trusts was already £5.5bn in 2016/17 (Figure 10), and this is likely to increase further over 2018/19, as trusts are still under substantial pressure to limit expenditure in this area.
Figure 10
While this approach to capital may make sense in the short term, it cannot continue. The NHS infrastructure cannot be continually run down without consequences for the quality and safety of patient care.
Continuing this approach will also undermine longer-term sustainability. As the National Audit Office highlighted in its 2018 report, capital to revenue switches have been one of the measures "which have restricted the money available for longer-term transformation" (National Audit Office, 2018).
While the government might have agreed to meet the funding requirements outlined in the Naylor review of property and estates, we are far from a situation where trusts can readily access capital to both meet backlog maintenance requirements, and to modernise and transform healthcare services.
As we enter 2018/19, NHS trusts have little certainty about how much capital funding will be available to them and which STPs it will be allocated to. This means that for many trusts, access to capital funding depends more on the performance of their STP and less on the actual requirements of their infrastructure.
Unfunded pay costs
We strongly welcomed the announcement that agenda for change staff will receive on average a 6.5% pay award over the next three years. We have been told that the Treasury will make £4.2bn of funding available to implement this. However, there are still some questions remaining about whether the award will be fully funded centrally or locally for agenda for change, and whether additional funding will be made available for any uplift above 1% for doctors.
It is crucial that a fully funded pay award is followed through in full. Given the budgetary pressures facing the NHS, an additional cost could not be absorbed by the provider sector.
- Funded pay award for doctors: one of the key risks remains about whether a pay award for doctors will be funded by government or have to be absorbed as a cost pressure by the sector. At the moment, the government has only suggested that it would fund a 1% pay award, so anything above this would need to be absorbed by trusts. Taking consultants as an illustrative example, a 2% pay award could cost the sector over £54m, and a 3% pay award would cost over £109m (assuming 1% is funded).
- Local authority vs NHS commissioned services: although the government has quite clearly committed to fully fund the pay award, one of the risks might be the extent to which local authority commissioned health services will be funded. Many services provided by community trusts are in fact commissioned by local authorities rather than NHS commissioners, despite staff being on agenda for change contracts. Health visitors provide a helpful illustration of the likely impact as the majority are providing services commissioned by local authorities. Assuming all 8,703 visitors are on a mid point band 6 of agenda for change, using the NHS pay calculator this could add an additional £63m cost pressure to NHS trusts. Given the level of savings providers have had to deliver on these services in recent years, this additional cost pressure could mean a number of services becoming unviable, particularly community services.
The financial sums involved also mean that, through circumstances beyond their control, these providers may be unable to meet their control totals and will also lose access to sustainability funding. This needs to be addressed.
Cost inflation
The national tariff is intended to ensure that prices and contracts reflect current levels of inflation. The tariff for 2018/19 (part of a two-year tariff), increased prices by 0.1% in cash terms. While this is supposed to be net of inflation all the evidence suggests that costs are currently increasing at a much higher rate in the NHS (Gainsbury, 2017).
For example, in 2017/18, official NHS inflation forecasts imply that providers would have to absorb 2.3% of additional cost pressures (Table 4). However, according to the Nuffield Trust, there are several signs that inflation has been increasing at a faster rate, which means that providers will have to absorb a higher level of cost inflation than the 2% indicated by the official forecasts (Nuffield Trust, 2017).
Table 4: NHS inflation forecasts
[2] Pay drift refers to the tendency for staff to move to a higher increment or to be upgraded and also incudes the impact of over time. Staff group mix refers to the movement in the average unit cost of labour due to changes in the overall staff mix (eg the relative proportions of senior and junior staff, or the relative proportions of specialist and non-specialist staff).
Even if inflation remains within next year’s forecast, their analysis still shows trusts will need to deliver a higher rate of savings just to stand still. The level of recurrent savings that can be made next year will only go some way to cover the forecast increased activity and unfunded inflation. They will do very little to address the underlying deficit (Gainsbury, 2018).
Provider sustainability funding
Only those trusts signing up to control totals are eligible to receive provider sustainability funding (PSF). The size of the provider sustainability fund has increased from £1.8bn in 2017/18 to £2.45bn in 2018/19.
Looking at current performance and our survey findings, there are a number of risks materialising in relation to this source of funding next year:
- Given the higher proportion of trusts not planning to sign up to a control total (18% compared to only 10% this year), more providers are likely lose out on sustainability funding next year.
- NHS trusts are not confident that they will be able to meet the necessary financial and performance targets to access PSF. As reported earlier, only just over a third of trusts were confident that they meet their control total (which gives them access to the majority of the PSF), and only 5% were confident that their local area would meet the A&E performance target (which gives them access to 30% of the PSF pot).
- For 2017/18, 43% of the sustainability funding will remain unallocated at the end of the year, which will then be distributed to those providers which have met their financial control total. Next year, if the same scenario plays out, over £1bn could be left unallocated. Assuming the current bonus and incentive rules stay the same, this £1bn may well be re-distributed to an ever decreasing number of trusts.
- This leads to substantial variation across the provider sector. By December 2017, around half of providers had not been able to unlock their forecast share of sustainability funding. When looked at by type of trust, the situation is worse still in the acute sector, where only a third (31%) have unlocked their full share of sustainability funding, compared to 87% of community and mental health trusts (Figure 11) (NHS Providers, 2018).
Figure 11
Sustainability funding is used principally to support balance sheets, rather than day to day spending or investment. Based on trends in 2017/18, the funding is not always reaching the frontline providers in most need. As one finance director told us last year, the sustainability fund "incentivises good performance but penalises those organisations with the greatest pressures and arguably in need of the greatest support…it has the potential to broaden the gap between lowest and highest performing trusts" (NHS Providers, 2017). The funding is highly concentrated in increasingly fewer providers.
Although one of the key benefits of the PSF is that it remains within the provider sector and can be used to support the aggregate financial position, the scale of the task built in to control totals means that an increased proportion of providers might not be able to rely on this source of income for next year.
Mental health investment
A key priority outlined in the mental health Five year forward view, and confirmed in the planning guidance for 2018/19, is to increase investment in mental health services. CCGs are currently required to meet an 'investment standard', whereby they are required to increase their spending on mental health services at least in line with the growth in their overall allocation.
However, there are warning signs that this is not materialising in to the investment we need. Research from the Royal College of Psychiatrists shows that NHS trust income in 2016/17 was lower in real terms than in 2011/12 and 62% of mental health trusts reported lower income (Royal College of Psychiatrists, 2018). This follows earlier work we did, looking at whether additional commissioner investment was reaching frontline mental health services (NHS Providers, 2016).
A key priority outlined in the mental health Five year forward view, and confirmed in the planning guidance for 2018/19, is to increase investment in mental health services.
Looking ahead to 2018/19, NHS England has strengthened the investment requirement on CCGs, by introducing an independent validation by CCGs’ auditors. Although CCGs funding allocations will grow by 2.2% per capita, this doesn’t include the £400m ring-fenced to support commissioner bottom lines as part of the commissioner sustainability fund.
According to our survey, around a third of all trusts (30%) were not confident that their local CCGs would meet the standard in 2018/19 (Figure 12). This figure increases to 50% of mental health trusts, underlining their concerns that a key risk for next year is sufficient investment not reaching frontline mental health services.
Figure 12
Furthermore, only 3% of trusts (5% of mental health trusts) were confident that the additional requirement for independent validation by the CCGs’ auditors would support commissioners to meet their investment commitments. Trust leaders were concerned there is a lack of definition in the guidance when it comes to the investment standard.
Whilst the principle is a very positive one, the audit….[will] likely be too late to encourage commitment at the contracting stage for 2018/19 and possibly even 2019/20.
Trusts will do all they can to meet their financial targets next year, but as things stand the scale of the ask is too high and there is a real risk of compelling trusts to sign up to the levels of efficiency saving which trusts believe are impossible and the Kirkup review confirms some are way beyond what is "generally regarded as the upper end of achievability". The deficit this year is well above plan, because the plan providers were set this year was unrealistic based on levels of demand. We explore what we need to do in response to this in section 5.