

Waiting lists
The community services waiting list has now exceeded 1 million people for a year. It is now 5.8% larger than February 2024, when 13 new providers came into the scope of reporting for the community health services monthly sitrep.
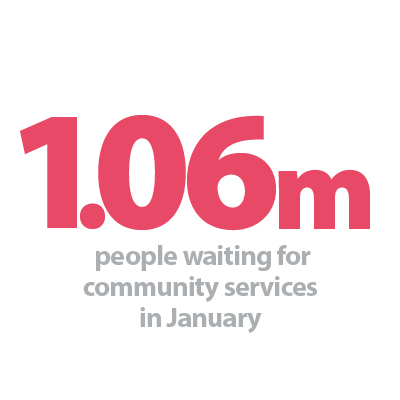
- After falling steadily since August 2024, the community services waiting list has increased since December, rising by 1.4% to 1.06 million people in January.
- There were 289,260 children and young people (CYP) waiting for community services in January, an increase of 7.3% from the previous month.
- The number of adults waiting for community services fell again this month, decreasing by 5,280 from December to 769,460 in January. This drop also represents the lowest figure seen since February 2024.
- 24 trusts account for the top half of the total waiting list in January, with seven trusts reporting over 20,000 patients waiting for treatment.
Figure 6
Community health services total reported waiting list

Waits over 52 weeks
As highlighted by the Darzi report, long waits for community services risk being normalised. In January 2025, the total number of waits over 52 weeks reached a record high of 67,890, marking a 17.2% increase from December. This increase was driven by a rise in the number of CYP waiting more than 52 weeks for treatment, while the number of adults remained broadly unchanged from the previous month.
- There were 10,470 adults waiting more than 52 weeks for treatment, a slight increase of 0.6% from the month before. Of these, 964 adults were waiting more than 104 weeks for treatment.
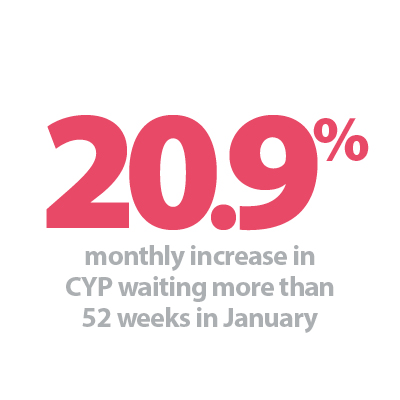
- However, the number of long waits for CYP reached another record high in January. There were 57,420 CYP were waiting for 52 weeks or more, marking a 20.9% increase from the previous month. Of these, 10,550 CYP were waiting for 104 weeks or more.
- Since February 2024, when 13 new providers were added to the reporting scope, the number of CYP waiting over 52 weeks has risen by 109.3% - more than doubling in size.
Demand and activity
Referral requests for community services and care contact activity have fallen in the latest month:
- Referral requests fell for the second month running in December, with 1.57m referrals recorded, decreasing by 7.8% from November. However, referrals remained 11.5% higher than the same period last year.
- Referrals have increased by 64% compared to five years ago, before the pandemic, highlighting sustained growth in demand for community services.
- Care contact activity levels fell by 5.8% from November, dropping to 8.47m care contacts recorded in December. Activity was 8.5% higher than the same time last year.
Figure 7
Total referrals received by community services

UCR services, virtual wards and intermediate care
Urgent community response (UCR) referrals
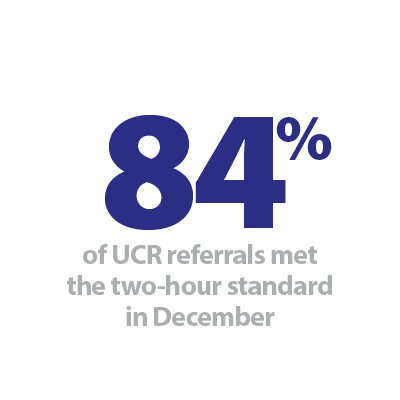
- In December, 84% of UCR referrals met the two-hour standard for delivering UCR services, with trusts exceeding the national objective for another month.
- The target was met across most reporting trusts with 79 out of 88 meeting the 70% target in December. 11 trusts delivered UCR services within the two-hour window to 95% of patients.
Intermediate care - delayed discharges
In February 2025, an average of 2,287 patients per day no longer met the criteria to remain in intermediate care. Of these, 87.3% remained in hospital at the end of the day, unchanged from January.
- This means that nearly six out of every seven patients that were medically fit for discharge remained in intermediate care at the end of the day. The proportion of patients remaining in intermediate care each day despite no longer meeting the criteria to remain, has never dropped below 87%.
Virtual wards
- As of February 2025, virtual ward capacity was 12,720, reflecting a slight increase of 0.8% compared to the previous month.
- There were 9,340 patients receiving care through virtual wards, meaning the occupancy rate was 73.4% in February, down from 80.5% in January.
- The virtual ward capacity per 100,000 GP registered population aged 16 years and over stood at 20.1 in February – slightly higher than last month but below the longer-term ambition of 40 to 50 virtual beds per 100,000 people, as outlined in the Delivery Plan for Recovering Urgent and Emergency Care.
Figure 8
Virtual ward occupancy rate (%)
