

Demand and activity
Over the last few years, following pressure from the sector and stakeholders, NHS England started collecting and publishing more and more data on the community sector. This data now provides us with a national picture.
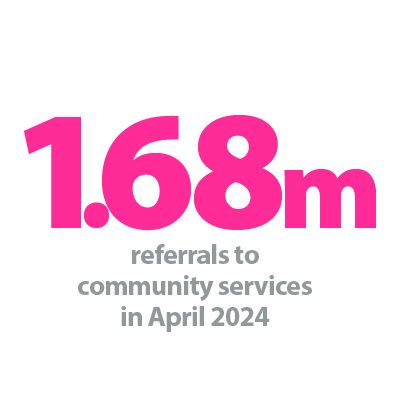
As shown in figure 4, demand for community services shows no sign of slowing down. In April 2024, the highest number of referrals on record was reported for community services: 1.68 million. In the year prior to the Covid-19 pandemic (February 2019-February 2020), there were on average 1.1 million referrals a month. Referrals dropped back during the early months of the pandemic but have been rising consistently since the autumn of 2020. In April 2024, referrals were 24% higher than a year ago.
Total referrals received to community services
Trusts have been increasing activity to meet this unprecedented demand. Care contacts – a contact or appointment between a person and a care professional – totalled 8.71 million in April 2024. Monthly care contacts averaged 8.48 million in the year ending April 2024, which is on average nearly 500,000 higher per month than the year ending April 2023.
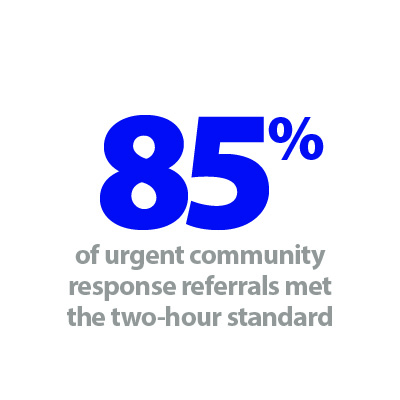
The 2023/24 priorities and operational planning guidance set out a national objective for trusts to consistently meet or exceed the 70% 2-hour urgent community response (UCR) standard. Trusts have met this standard every month recorded in the dataset. As of April 2024, 85% of UCR referrals met the two-hour standard for delivering UCR services. Performance in this area is improving too: April has seen the fourth monthly increase in a row. The target has been met across most reporting trusts: 80 out of 91 reporting trusts met the 70% target in April. Furthermore, 27 of 91 trusts delivered UCR services within the two-hour window to 90% of patients.
Percentage of 2-hour UCR referrals achieving the 2-hour standard

Delayed discharges
More recent data for June considers the patients residing in, and discharges from, community providers. The data tells us about discharge delays: the number of patients that were not discharged by the end of the day despite no longer meeting criteria to reside. For the month of June, 89% of patients who no longer met the criteria to reside remained in the care of community providers each day. This percentage has been broadly consistent since data was first recorded in October 2022.
Reducing discharge delays is critical to improving whole system flow for providers. This applies to any transfers of care between acute, ambulance, community and mental health settings and partners across domiciliary and social care. But, as we outline in our five shared commitments for delivering the next generation NHS, patients must be discharged into the right care at the right time. We must meaningfully support flow through the system with investment better following patient and community needs.
Waiting lists
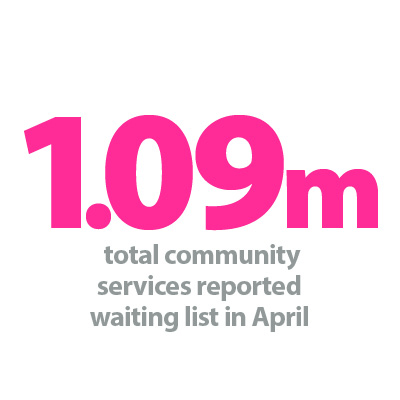
Demand, activity, and performance of community services providers all impact the community health services waiting list. The total community services reported waiting list increased for the fourth month running in May, totalling 1.09 million – the highest on record. The waiting list is now 8.7% higher than February 2024, when 13 new providers came into scope of reporting. 119 NHS trusts and foundation trusts reported wait list information in April with a combined list of 935,700. 22 of these trusts comprise 50% of the waiting list, with nine trusts reporting over 20,000 pathways waiting for treatment. Six of the trusts with waiting lists of over 20,000 predominantly provide community services only, with the remaining three being combined trusts.
Community health services total reported waiting list
The total waiting list comprises pathways for adults (799,900) and children and young people’s (CYP) services (287,300), both of which were at respective record highs in May 2024. 11,500 adult pathways and 39,600 CYP pathways had been waiting over 52 weeks, having increased by 16% and 10% respectively compared to April 2024. We look in further detail at the unique combination of pressures facing children’s services in our new report Forgotten generation: shaping better services for children and young people.
This waiting list data shows that patients in community services are waiting longer and longer. It is important that the national political and media narrative move beyond the focus on operations and take a broader and more considered approach to the less visible waiting lists across all sectors that are impacting patients.