The secondary care acute sector comprises acute, specialist acute and combined trusts delivering urgent and emergency care, planned care and specialised care for different conditions such as rare cancers, genetic disorders or complex medical or surgical conditions.
Demand and activity
A&E
- There were 2.22 million A&E attendances in January, a fall of just over 5% compared to the previous month. Demand is very slightly lower (-0.3%) than last year's record January figure, but still nearly 5% greater than January 2020, before the pandemic.
- There were 548,800 emergency admissions in January, around 1% fewer than last January and 2% lower than five years ago. This shows that increased demand at the front door isn't necessarily translating into an associated increase in emergency admissions.
Figure 1
A&E attendances

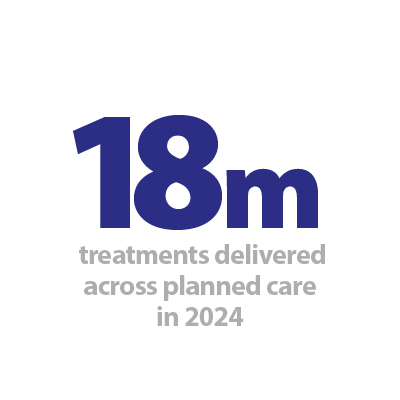
In 2024, there was record high activity across consultant led treatments and diagnostics. However, in line with the usual trend, activity fell across planned care in December as trusts balance their planned and emergency care capacity.
Consultant-led referral to treatment (RTT)
- In 2024, trusts delivered over 18 million treatments across planned care, 4% more than 2023 and 5% more than 2019, before the pandemic.
- In December, admitted activity and non-admitted activity dropped for the second month running with activity falling by 15% and 14% respectively.
- New RTT pathways, new treatments joining the waiting list, also fell by 11% to 1.55 million.
Diagnostics
- In 2024, trusts carried out 28.3 million diagnostic tests, which is 8% higher than 2023, 20% higher than 2019 (before the pandemic) and 50% higher than a decade ago, in 2014.
- This year (2024) there were 26% more MRI scans, 20% more colonoscopy scans and 37% more CT scans, compared to before the pandemic (2019).
- In December 2024, there were 2.24 million diagnostic tests, which is 8% lower than November. However, across 2024 there were a record number of tests carried out each month, apart from March (see figure 2).
Cancer
- Monthly activity was slightly lower across all pathways for the second month running in December. Compared to November the number of patients on the 28-day faster diagnosis pathway decreased by 8% to 244,100. For the 31-day pathway the number of people starting a cancer treatment decreased by 7% to 50,700 and those seen under the 62-day pathway decreased by 4% to 25,600.
Figure 2
Total diagnostic tests

Waiting times
The proportion of patients seen within four hours improved in January but longer waits of over 12 hours deteriorated.
A&E
- Performance against the A&E four-hour waiting time target increased to 73% in January from 71.1% last month, a move in the right direction towards the 78% target by March 2025.
- The performance across type 1 A&E only (excluding other types of A&E delivered by these trusts) also improved, by 2.4 percentage points, to 57.7% in January.
- Of the 121 reporting trusts with a type 1 A&E department, only 13 trusts met or exceeded the 78% recovery target.
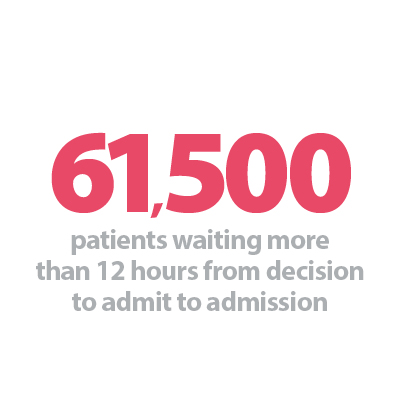
In terms of longer waits in emergency departments from time of arrival or wait from decision to admit to admission:
- 172,500 patients at a type 1 or 2 A&E waited more than 12 hours from arrival at A&E. This is 5,000 higher than December, but slightly lower than this time last year.
- There were a record number of patients waiting 12 hours from the decision to admit to admission this month: 61,500. This is an increase of over 7,000 from December 2024. This is 22 times greater than January 2020, before the pandemic, when only 2,846 people waited more than 12 hours to be admitted.
Figure 3
Number of patients spending >12 hours from decision to admit to admission

Consultant-led referral to treatment (RTT)
The elective and diagnostic waiting lists reduced slightly in size as activity remains high. But waiting times across planned care remain a challenge.
- The waiting list reduced slightly for the fourth month running to 7.46 million in December (16,600 fewer treatments than last month).
- The size of the waiting list is smaller than it was a year ago (-1.8%) but 63.5% greater than five years ago in December 2019, before the pandemic.
- Trusts reduced waits across the >52 week and >65 week thresholds, with a very small increase in waits >78 weeks and >104 weeks (up by eight and four treatments respectively).
- Waits over 18 weeks increased by 7,900 to 3.06 million treatments waiting >18 weeks, equivalent to 58.9% of all waits.
- In December, 83.5% of patients on the waiting list were unique patients. This is an estimated 6.24 million people (42,900 fewer than last month).
- 10 out of 155 reporting trusts account for 1.3 million treatments on the waiting list.
Diagnostics
- The diagnostic waiting list (which is a subset of the broader elective care waiting list) decreased this month by 52,600 to 1.56 million. Compared to last year, the waiting list is up slightly by 0.5% and up by 55.5% compared to December 2019.
- 22.8% of patients waited six weeks or more for a test, deteriorating from 19.9% last month and moving further away from the 5% target.
- Out of 156 reporting trusts, 28 met or exceeded the target to see 95% of patients in six weeks. The 10 trusts with the largest waiting lists have a combined list over 275,000 (18% of the list).
Figure 3
Total diagnostic waiting list

Cancer
In December, despite the fall in activity, trusts improved performance against all three standards. Trusts met the March 2025 28-day FDS target (77%) and the 62-day standard target (70%).
- Performance on the 28-FDS pathway continues to exceed the existing standard of 75% and exceeded the new 24/25 target of 77% early: 78.1% of people were told if they had cancer, or if cancer was definitively excluded within four weeks (28-days) of an urgent referral, up from 77.4% last month.
- 31-day pathway: Performance improved by 0.5 percentage points with 91.5% of people treated beginning first or subsequent treatment of cancer within 31 days of receiving a decision to treat/earliest clinically appropriate date but missed the 96% standard.
- 62-day pathway: 71.3% of people treated began a first definitive treatment of cancer within 62 days of an urgent suspected cancer referral, breast symptomatic referral, urgent screening referral or a consultant upgrade. This is an improvement of 1.9% from last month, already exceeding the 62-day standard target of 70% by March 2025.
Capacity
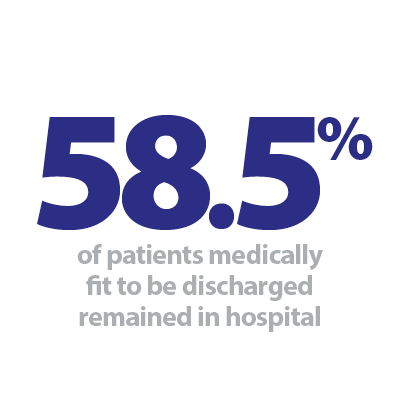
Over winter, maximising capacity is a key priority for hospital staff, particularly with the challenges of seasonal illnesses. However, delayed discharges remain a daily challenge for hospital staff across England:
- On average in January, there were 23,400 patients who no longer met the criteria to reside and of these, 58.5% remained in hospital each day. This is up from 55.4% in the previous month and a 23-month high.
More information on the latest bed occupancy figures can be found in the winter section.