NHS Activity Tracker: December 2025
Acute sector
61.2%
of type 1 and 2 A&E attendances met the 4-hour target in November
2.62m
diagnostic tests in October
1.68m
elective waiting list cases managed in October
Accident & Emergency (A&E) (November 2025)
A&E attendances
- There were 2.35 million A&E attendances this month, the highest November figure on record and up by 1% compared to last year.
- Just under three-quarters (74.2%) of patients were seen within four hours. Performance was above last year (72.1%) but below the 78% aim set for March 2026 in the 2025/26 planning guidance.
- New, experimental data on performance in type 1 and 2 A&E departments shows that 61.2% of patients were admitted, transferred or discharged within four hours, which is much lower than the overall four hour performance.
A&E emergency admissions
- There were 531,750 emergency admissions in November, 4% fewer than last year.
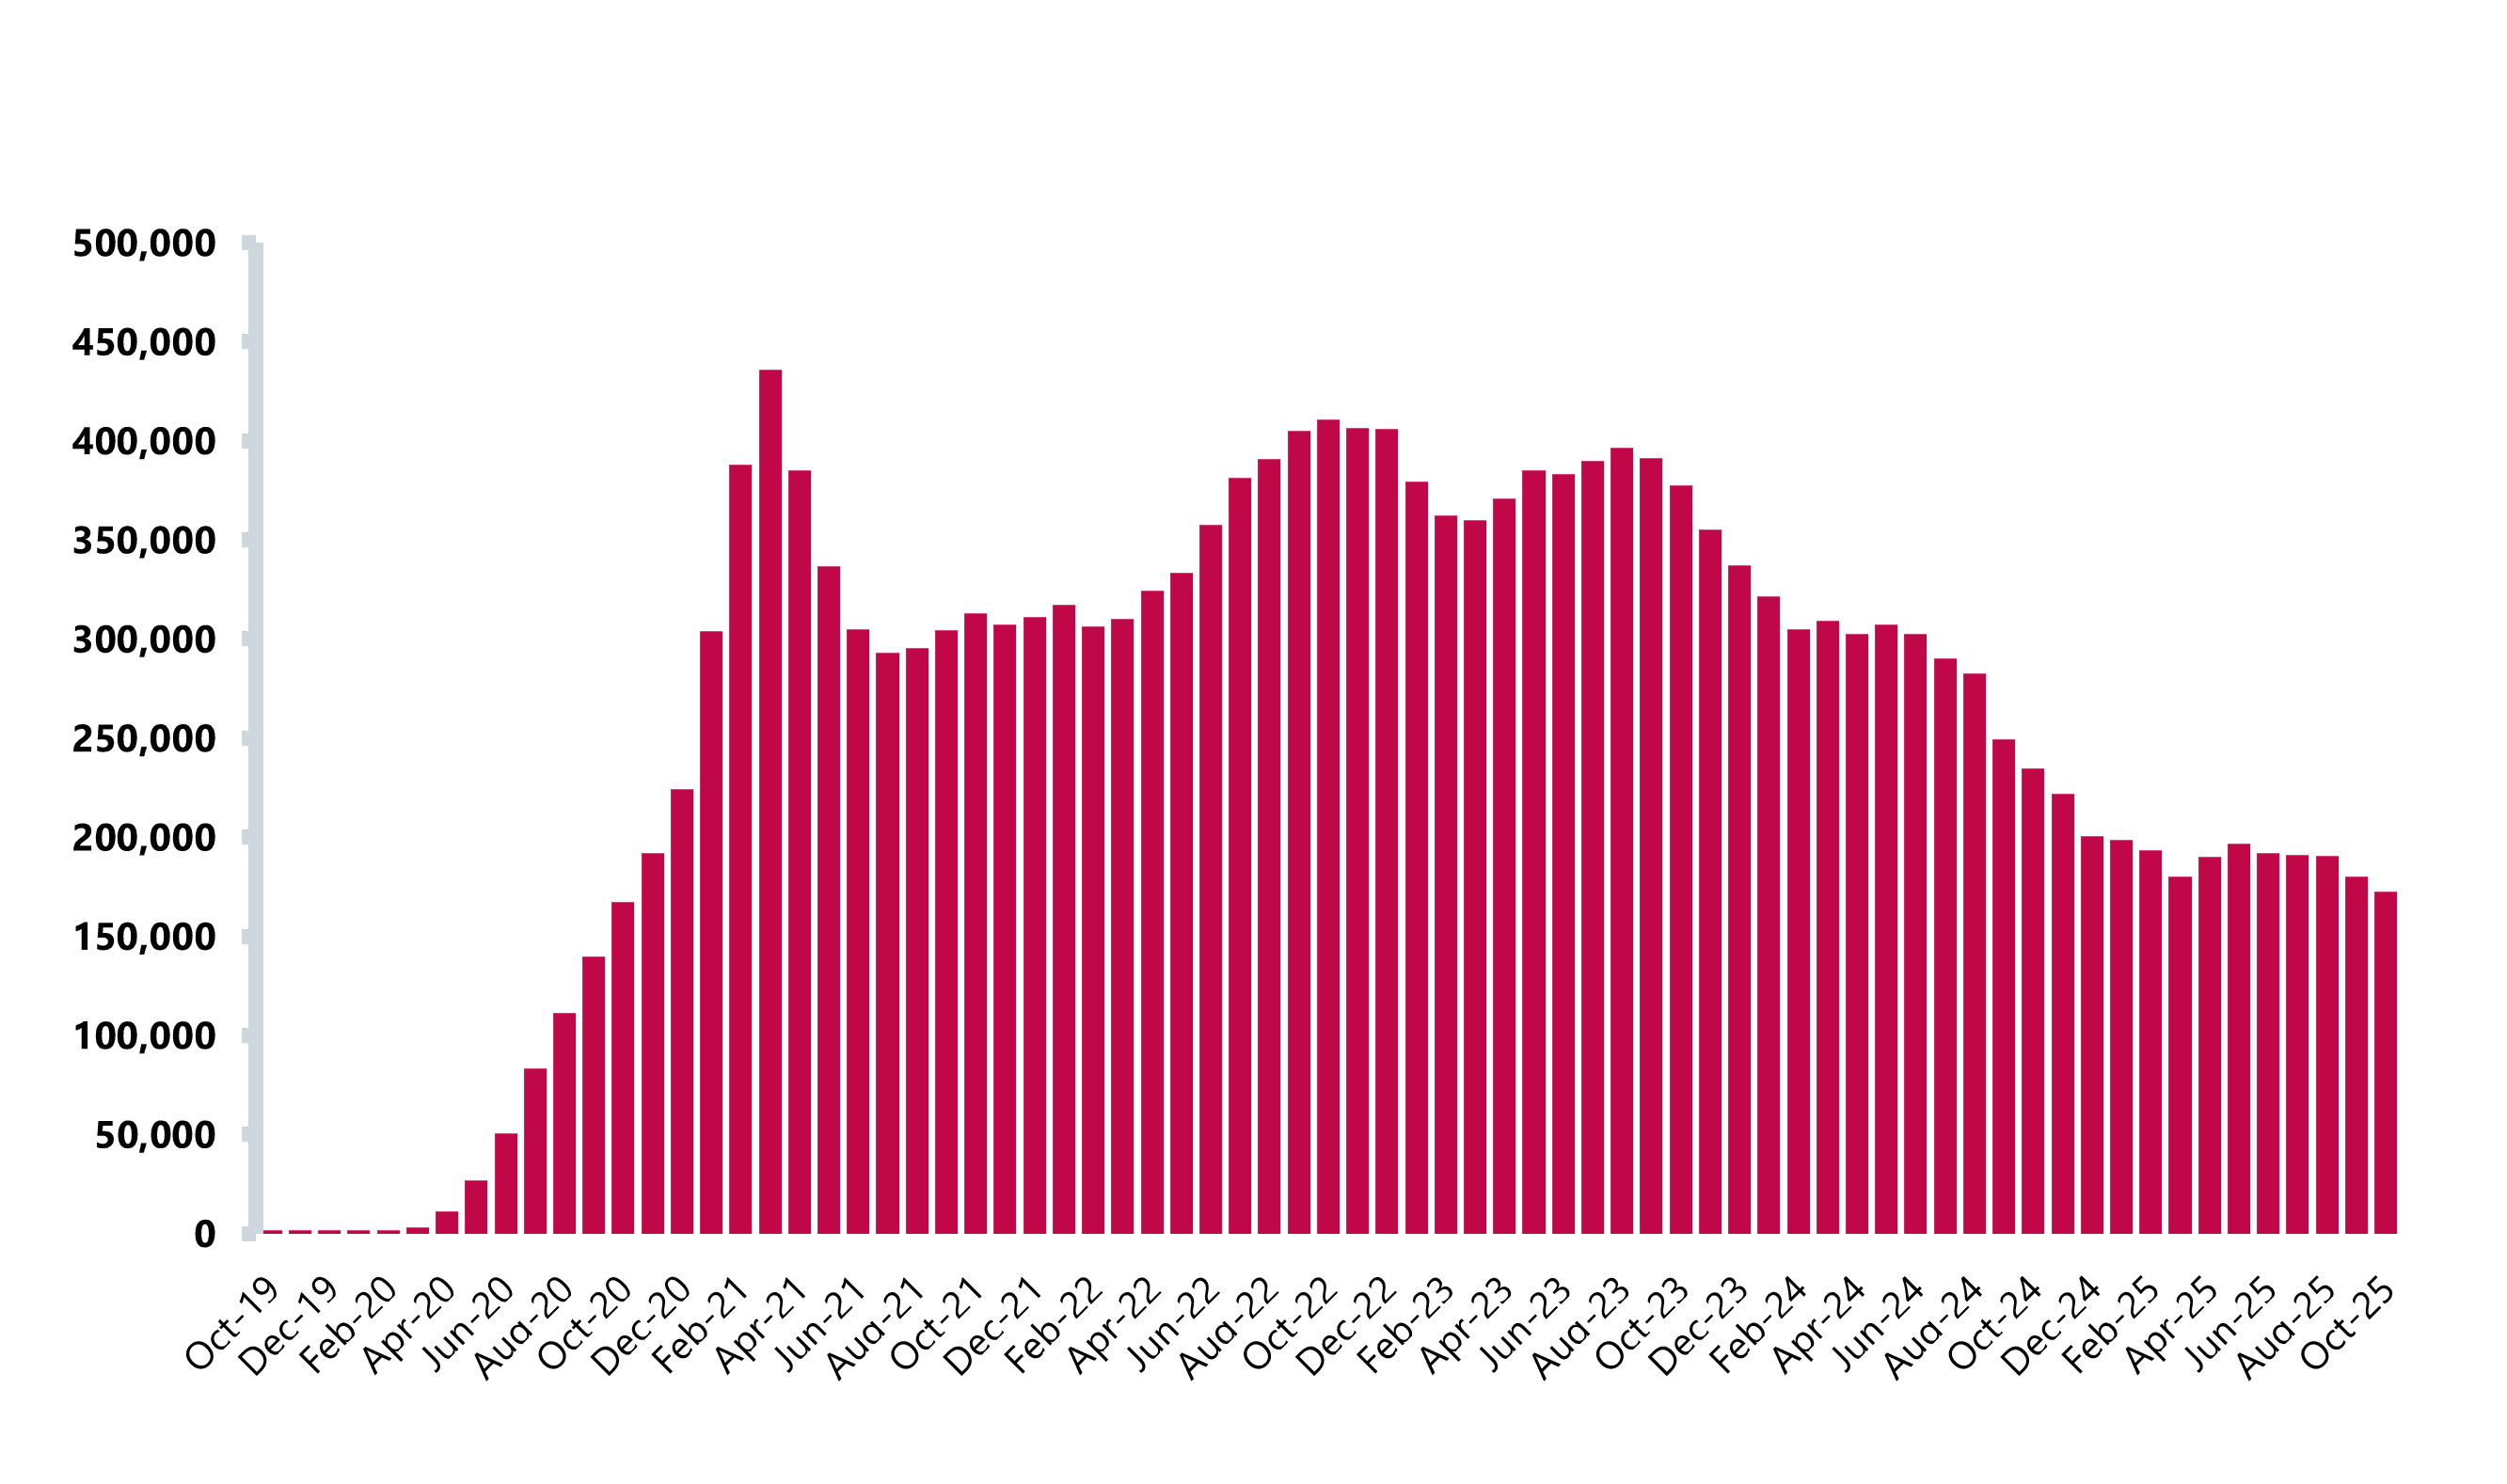
12-hour waits in A&E from decision to admit to admission
- In November, 50,650 patients waited at least 12 hours from the decision to admit to admission, a concerning 11% increase compared to last year and 45 times higher than November 2019.
12 hours in an emergency department (ED) from arrival
- 147,500 patients waited more than 12 hours from arrival at a type 1 & 2 A&E in November, 8% fewer than last year.
- Waits of over 12 hours in A&E occur 10.1% of the time, falling short of the 10% aim outlines in the UEC delivery plan published in June.
FIGURE 1
Number of patients spending >12 hours from decision to admit to admission
Acute discharge delays (October 2025)
- The proportion of patients who remained in hospital at the end of each day despite no longer meeting the criteria to reside stood at 58%, up three percentage points from last year. This increase signals ongoing strain on patient flow, posing a significant challenge for trust leaders with winter already underway.
Cancer (October 2025)
- October saw the second highest monthly activity on record across the 28-day faster diagnosis standard, 62-day pathway, and the 31-day pathway.
- Performance was slightly lower than last year on the 28-day faster pathway: 76.1% this October vs 77% last year. There were slight improvements in performance on the 62-day pathway (68.8%), and the 31-day pathway (92.5%) compared to last year.
- The latest figures are a considerable distance from the March 2026 aims set out in the 2025/26 planning guidance (28 FDS: 80%, 62-day: 75%).
Diagnostics (October 2025)
- 2.62 million diagnostic tests were carried out this month, the highest figure on record.
- The waiting list reached a record high of 1.79 million, up by 199,400 since last year. It is now 66% higher than in October before the pandemic, indicating sustained strain on diagnostic services.
- 78.7% of patients were seen within six weeks for diagnostic tests, up slightly compared to last month, but performance has generally been moving away from the 99% constitutional standard since the start of this year.
Elective waiting list (October 2025)
- The size of the waiting list rose by 6,000 cases to 7.4 million in October. This is 145,900 fewer cases than last year but the list remains significantly elevated compared to before the pandemic (2.8 million more cases than in October 2019).
- In October, 84.3% of patients on the waiting list were unique patients. This is an estimated 6.24 million people.
- The number of cases waiting more than 18 weeks was 2.83 million in October, falling by over 268,000 compared to last year. Waits over 18 weeks are equivalent to 61.8% of all waits, with progress needed to meet the planning guidance sets aim for 65% of treatments to be waiting no longer than 18 weeks by March 2026.
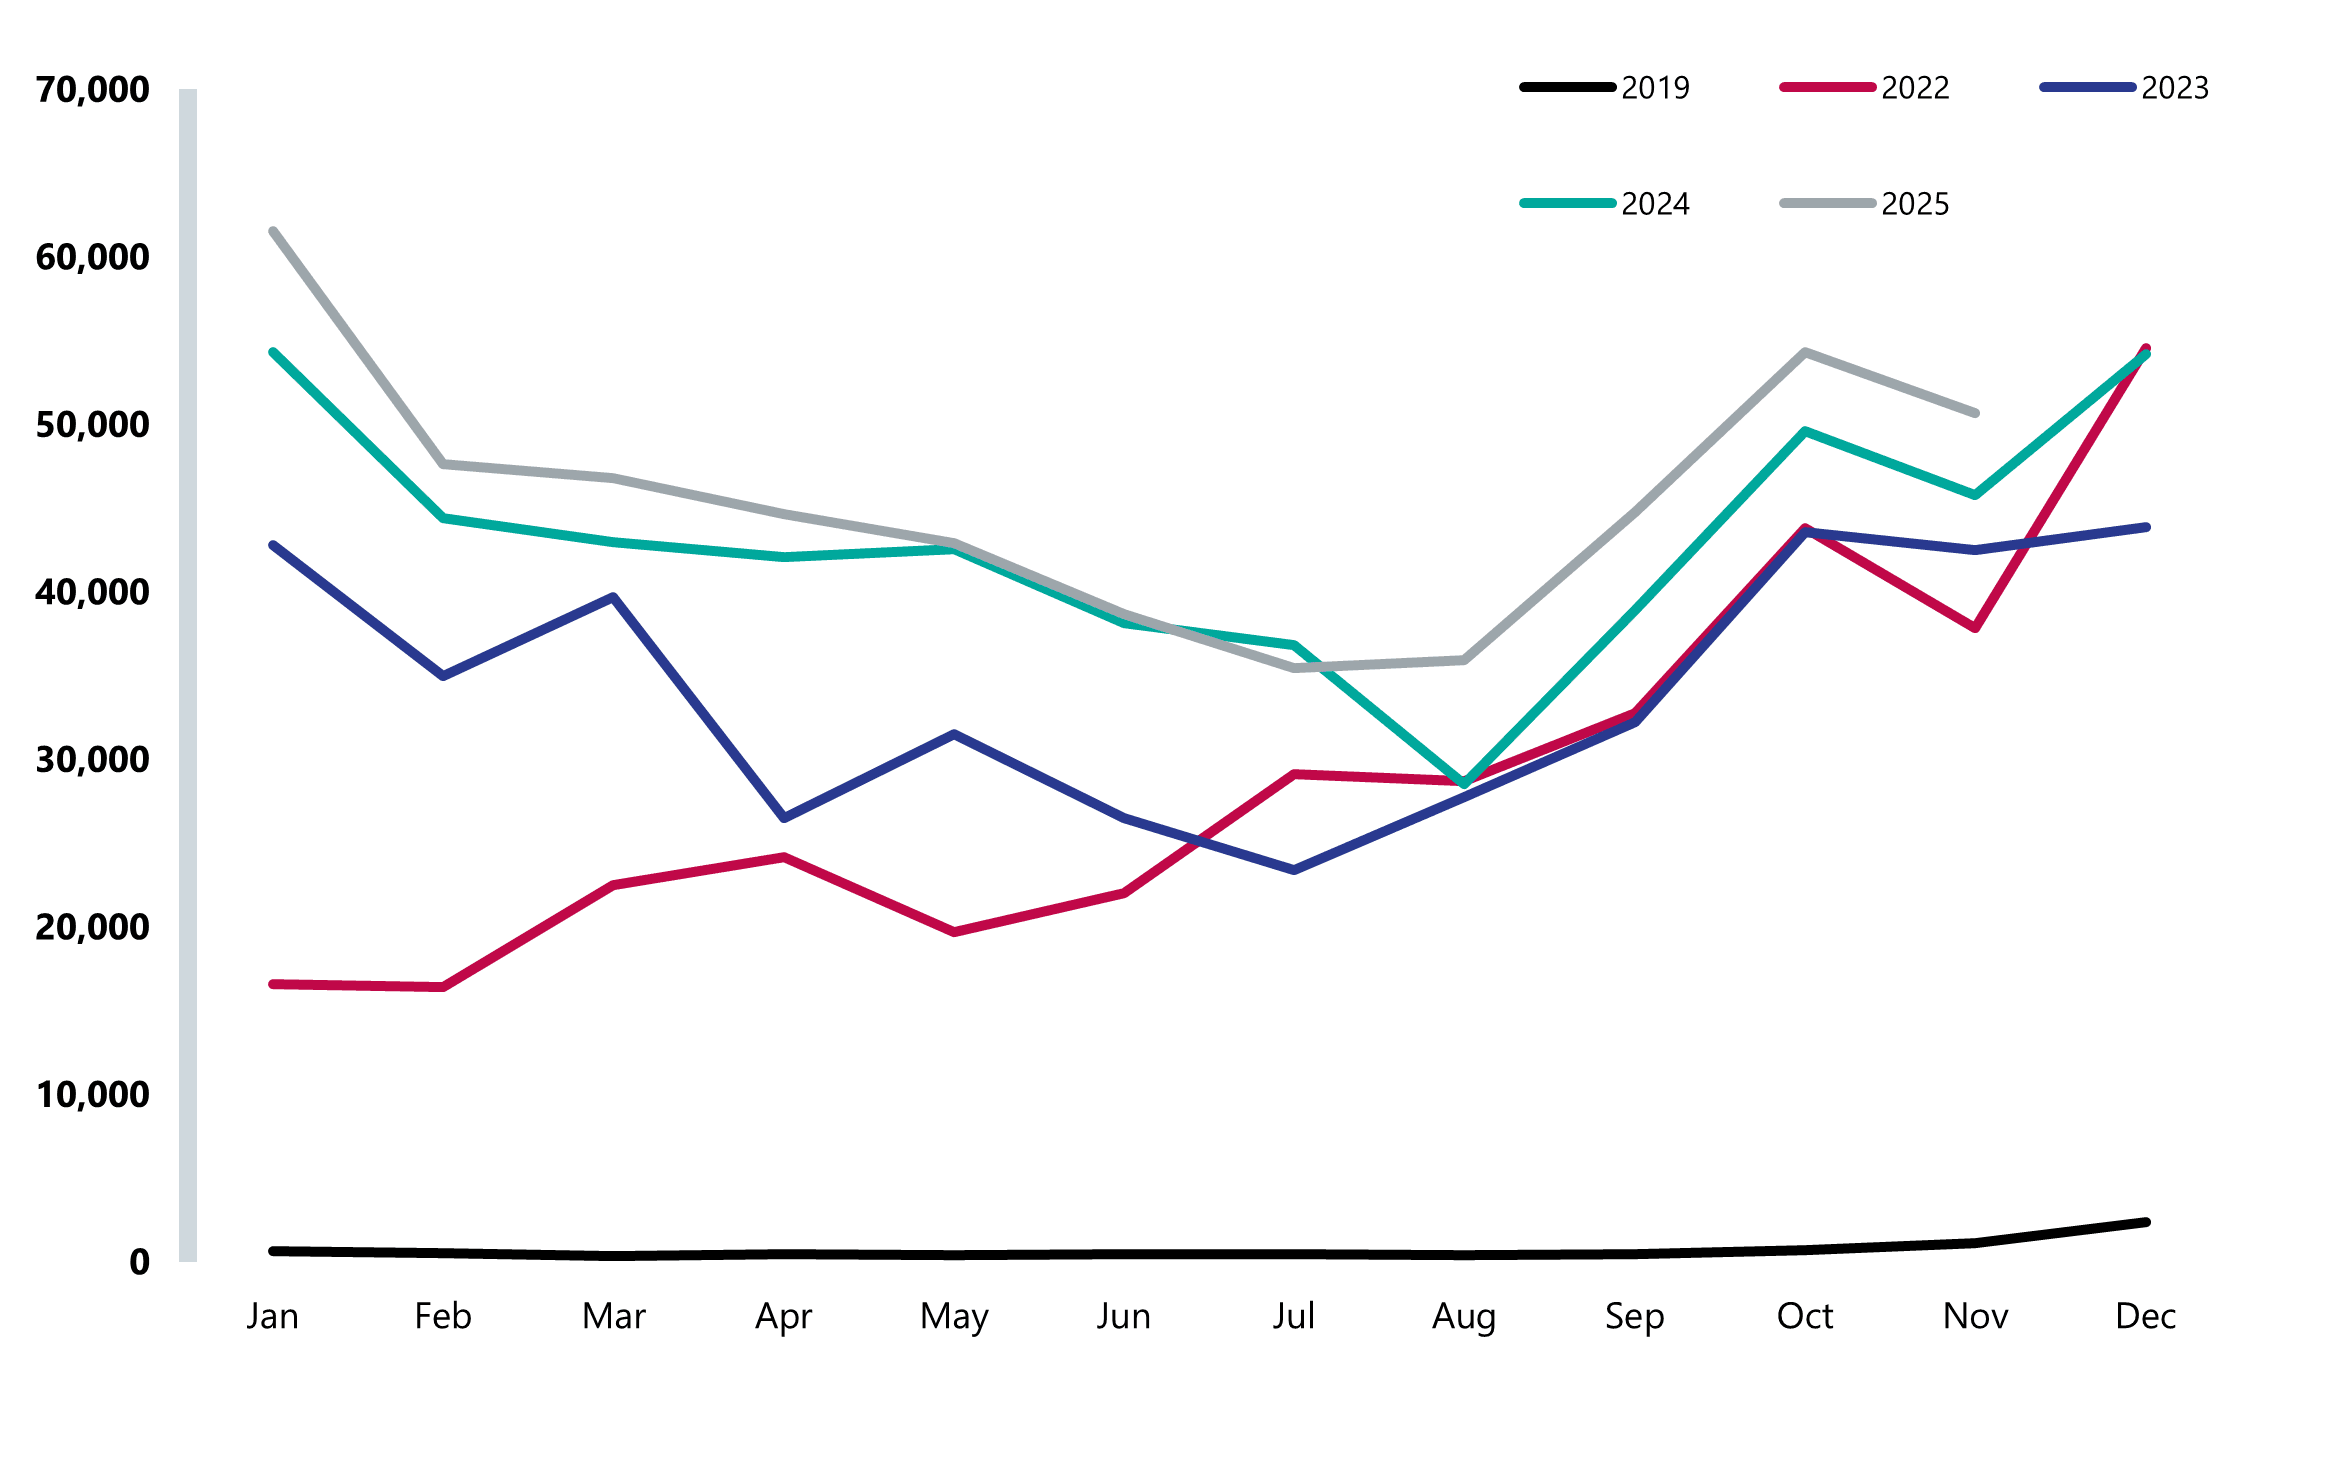
- Waits of over 52 weeks (172,560) have fallen by 7,770 since last month and now account for 2.3% of all waits. The planning guidance sets out an aim for waits over a year to account for 1% of all waits by March 2026.
- 1.68 million cases were managed on the waiting list this month, the highest figure on record. Demand for elective care, measured by new cases added to the list (1.93 million cases) continued to outpace activity, reaching the second highest figure recorded.
FIGURE 2
Cases waiting over 52 weeks on the elective care waiting list